Learn more about
Understanding Senior Care Demographics and Trends in Atlanta
A Profile of Older Americans
Source: Department of Health & Human Services, Administration on Aging
- The number of Americans aged 45-64 who will reach 65 over the next two decades – increased by 26% during this decade.
- Over one in every eight, or 12.9%, of the population is an older American.
- Persons reaching age 65 have an average life expectancy of an additional 18.6 years (19.9 years for females and 17.2 years for males).


“My husband relates well with all providers. That is important to me.”
– Martha S. , Wife of our care recipient
-Decatur , GA (2018-09-21)
Projected Future
Growth of the Older Population
- Between 2010 and 2050, the U.S. population is projected to grow from 310 million to 439 million, an increase of 42 percent.
- Between 2010 and 2050, the United States is projected to experience rapid growth in its older population. In 2050, the number of Americans aged 65 and older is projected to be 88.5 million, more than double its population of 40.2 million in 2010.
- About 2.6 million persons celebrated their 65th birthday in 2009. In the same year, about 1.8 million persons 65 or older died. Census estimates showed an annual net increase of 770,699 in the number of persons 65 and over.
- There were 64,024 persons aged 100 or more in 2009 (0.2% of the total 65+ population). This is a 72% increase from the 1990 figure of 37,306. (Source: Family Caregiver Alliance – National Center on Caregiving)
Where do People Receive Long-Term Care & from Whom?
- 34 million caregivers provide care for someone aged 50+.
(Source: National Alliance for Caregiving and AARP) - Most people—nearly 79%—who need Long-Term Care live at home or in community settings, not in institutions.
(Source: Agency for Healthcare Research and Quality) - While caregivers can be found across the age span, the majority of caregivers are middle-aged (35-64 years old).
(Source: National Alliance for Caregiving and AARP) - The number of Home Health Aides in 2008 was 1,738,800 and is expected to grow by 48% to reach 2,575,600 by 2018.
(Source: Bureau of Labor Statistics)

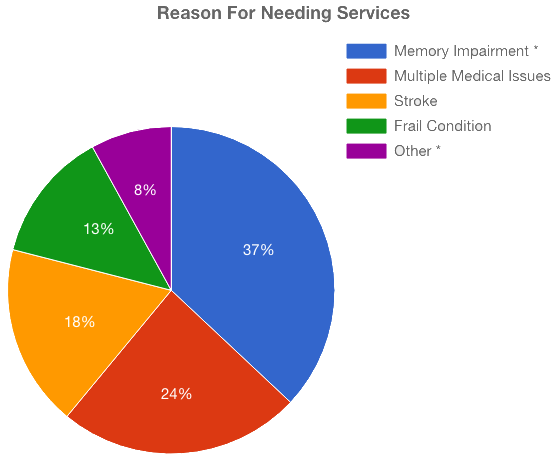
* Memory Impairment (Dementia/Alzheimer’s)
* Other (includes respite & post-operative care)

More Stats:
More than 34 million adults –16 percent of the adult American population – provide care to someone aged 50 years or older. About 70 percent of adult caregivers get help from family members, friends or neighbors. And about 30 percent rely on help from paid caregivers. Someone caring for a spouse spends more than 30 hours a week directly caring for their loved one and is less likely to get help from relatives or friends. Long-distance caregivers spend an average of $392 a month on travel and out-of-pocket expenses as part of their caregiving duties.
Who Calls Options and For What Reasons?
U.S. Demographics
In 2009 the United States population was comprised of approximately 40 million individuals who are 65 and older, with 6,800 being added to that number each day! This number of seniors consists of 12.8% of the total population of 312 million people. By 2030, that number will surpass 75 million at which time one out of five people is estimated to be in need of home care services. In 2050, seniors age 65 and older will make up 21 percent of the total population.
Interesting Facts
- The number of men age 65 and older: 72 for every 100 women in the same age group.
- The number of men age 85 and older: 45 for every 100 women in the same age group.
- The approximate number of centenarians (people age 100 or older) in the United States in 2009: 84,000.
- The projected number of centenarians in the United States in 2040: 580,000.
- Adults age 50-64 who use the Internet: 29 percent.
- Adults age 65 and over who use the Internet: 8 percent.
- 71% of today’s baby boomers have at least one living parent.
Locations Where We Provide Our Services
Though the majority of our patients require care to be provided in the comfort of their own home, Options For Senior America is equipped to provide care for your loved one even if they no longer live at home.


